- Details
- Written by: S. Joseph Winston
- Category: Science Article
- Hits: 353
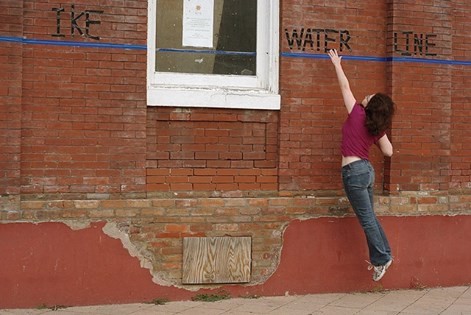
Foot Prints of the Flood !!
Immediately at the wake of any calamity, everyone is busy in settling back at home to reconstruct the livelihoods. Everyone and every animals walking and slithering will set a trail of foot prints behind. The forensic analysis will help categorize the foot prints. But how many do know that the foot prints are set by the floods? how many do know the importance of such flood footprints?
What is a flood foot print?
The water level marking on the structures like walls, poles or any surface where the color change due to the flood water is called the flood foot print. But if there are no flat surfaces, then the assessment of water level is through the damage it has caused. Hence the flood foot print is the water level marking at various places.
How to do the flood foot printing?
Every trailing foot prints have a ephemeral life. The clearing of the mess by revamping, reconstruction, refurbishments etc. will accelerate the expiration of this flood foot prints. In order to catch them when they are alive, immediately at the wake of the any major floods, all the districts, towns, cities devastated by the deluge need to be surveyed for the foot prints. The team of experts need to visit the places and make a noting on their records the Latitude- Longitude of the field of measurement and the water level marking from the demarcation it left on the walls by dirt and sediments. It is quiet easy to read these information from the structures that saw these floods. While doing these surveys, it becomes prime importance to draw a prominent marking on the structures that would last long for eg. a Lighthouse, a clock tower, a permanent pole, a stone walled permanent structure on a common place where it would last for ever/long.
Why is the foot print important?
Every forecast is based on certain theory and every theory is based on authentication from experiments and every experiment depend strongly on good measurements. Hence for any analysis the cross checking parameter would be these flood foot prints. I know how much myself and Dr. R. Rajaraman were ruing around for field measurement data to validate the tsunami modeling we did. However, to validate the flood and impact of flood modeling require these field measured data to fine tune and to validate for future forecasts. This helps a lot in the mitigation studies. This water level marking will also sensitize the local people to be prepared for any untoward incidents in future due to floods and also be warned of constructing any structures at lower elevations. A comprehensive data on water level markings (flood level -heights) on a vast area is a very good data for comparison and validation of analysis codes. This also gives a enormous confidence for the local authorities for the extent of flooding due to the rains. It must be noted that these markings will give a lifeline guide to the stranded people who are running for help to choose a safe area during flooding. They can understand clearly from the marked water levels where to run and take shelter safely. Further one must understand that these levels can also be retro fitted with the slow flooding models from the data set i discussed earlier (https://www.facebook.com/notes/joseph-winston-s/delving-into-the-deluge/10215025359086141/) . This would eventually lead to a reverse engineering work such as , from rainfall level in centimeter to flood water level computations. One must understand clearly here that there is no fluid mechanics model involved here, but only the Geo reference data and rainfall to flood level correlation only. This will make even any non technical personal who has a good statistical knowledge to start up the analysis and do accurate forecasting.
What are we to do?
**WARNING**
Have we done the task, field measurements? Have we reported the water level marking and recorded the same with respect to Geo reference in all Kerala districts? Have we documented this data with due respect through proper backup and archival?
IF NOT!
CATCH THEM BEFORE IT DIES!!!!!
As a learned society we must do it to save and protect us from future floods! Let us sensitize to have a state level Disaster Management State level- High level analytical team. Sensitize the town planning office to keep these records and centralize for all districts.
LET US SENSITIZE and ACT!
#Keralafloods; #Flood; #waterlevel
#FootPrints; #Flooddata #Floodanalysis
S. Joseph Winston (
- Details
- Written by: S. Joseph Winston
- Category: Science Article
- Hits: 364
Delving into the Deluge!!!!!
(S. Joseph Winston, E-Mail:
May- 2021
(PS: If you are interested to know how to model tsunami and river water flow modeling extended to flooding due to dam break, please read the article. Comments welcome !)
In the recent days when Kerala was battered by the severe flood condition, it makes us think if at all is possible to stop the suffering or alleviate the pains by means of any mitigation measures. No one plans to fail but may fail to plan. The aftermath of the 2004 tsunami when there was a severe property loss and life loss in and around kalpakkam, it made me and my close friend Dr. R. Rajaraman think seriously about tsunami modeling. I lost my Ford Ikon car and he lost all the valuables in the house. We often sat and discussed how to understand and model tsunami. But the drive within us was gaining momentum just may be because the damage it caused made us to over power tsunami by understanding and have a control over it. That is where we were seeking support from the experts. The first one who came to our help was Dr. Tad Murty, from Ottawa university, Canada and then Prof. Joaquim Luis from Portugal who made the Mirone code in Matlab.. Later Dr. Ole Neilson from Australian National University who is the main person behind ANUGA code. We started all our runs for the Indonesian tsunami which created a devastating results in the Tamil Nadu and south Kerala coasts. We had an opportunity to obtain the results and validate with the field measured data all over the coast (https://www.tandfonline.com/doi/abs/10.1080/01490410600939199). The results matched very close and there we were at real high spirits to take up to the next level. Further we modeled Fukushima Diachi Nuclear Reactor site japan due to the major tsunami which hit Japan and the results were very close to the field collected data. All from open source softwares and open source data.
Now, looking at the proliferation of data sharing and open source, those high end computations which were once only possible from the advance labs became possible for the common man. Hence instead of blaming the politicians or any organized structure responsible for such analysis, it must be taken as a challenge by the common people who have the ideas in these lines to perform such analysis and play a pivotal role in the mitigation efforts taken up to revive from such natural calamities. It is quite impossible to stop the natural calamities by the sudden flooding but however is much possible to reduce the impact by advance warning systems and best recovery methods.
This document will throw information about, how to carryout such flood modeling and to understand and educate the field operating staff to be well informed and also well equipped. Where ever possible I have provided links for cross reference which will also help you to download the open source codes and data for the analysis. I would strongly propose the Mechanical Engineering and Civil engineering guys to set a foot on these analysis and keep the agencies concerned well informed. I intent to say that the freelancing work will eventually snowball into a much bigger action plan and help Govt agencies or the organized responsible agencies to either take up the results and directions or to get provoked to do the same and achieve the mitigation plans.
Two categories of flooding:
(a) Slow Water level increase
(b) Sudden water level increase
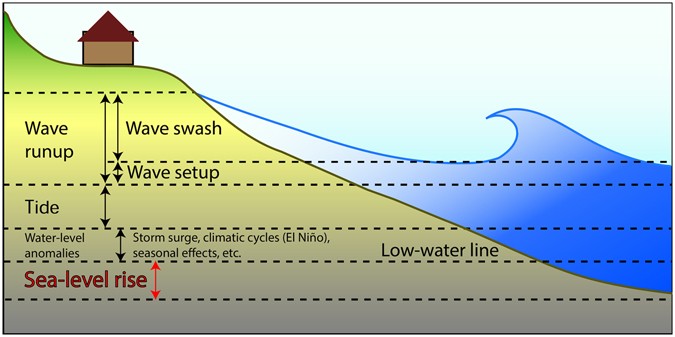
The slow water level increase can happen due to a long spell of rain. It might be a heavy rainfall to medium, however the water level increase is at a slow rate. This also can happen when we experience a low depression in the seas and slowly it manifests into a cyclone or a wild gust. This low depression causes local sea swelling and through the river and backwater by inundating into the land. Mostly this will also be worsened by rains which generally adds up to the woes. However this also is a slow increase in the water level.
The sudden increase of water level can primarily happen due to tsunami or dam breaks, however tsunami being the most devastating by fastest water level increase with forced circulation. The forced circulation dissipates a lot of energy into the coast structures and also to the human lives causing severe loss of lives and properties. The energy dispassion on these coastal bodies caused damages will be more than the slow drowning of lives. The dam breaks also cause a similar scenario, but the field of damage only change, tsunami causes coastal area damage and the dam breaks cause the flow side field of the dam outlets consisting of the major and minor channels. Though the flooding is slow in the tertiary channels, the primary and secondary channels on the dams discharge fields see both energy dissipated damages and the the flooding effects.
From the view point of the mitigation of life loss, it must be clearly addressed as mitigation studies for forced circulation and the slow flooding because the type of mitigation efforts will be so different from one another. However, in all the cases one has to take a conservative approach and also develop preparedness for calamities since the power of the nature cannot be completely mitigated. Hence a comprehensive salvage plan also to be worked out and kept in place. In a nutshell the effort has to be on two lines, one being mitigation efforts and second being the recovery methods Mitigation efforts to reduce the impact damage and the recovery methods to create proper channels and procedures to reach the rescue operations to the suffering lives. For the governmental plans even the third aspect, rehabilitation scheme also may be planned and kept in place for faster return back to normalcy from any such natural calamities.
Tsunami Modeling:
Until 2004 the Japanese word tsunami (Tsu- harbor , Nami- Wave called as harbor wave) itself was unfamiliar to many. The Tsunami is a transcontinental giant wave propagation over the ocean to dispense all the energy to the coast causing huge damage to human beings and coastal structures by means of huge force as well as through inundation. Modeling and simulation of tsunami waves will be helpful to understand its impact on the coast areas and prepare emergency procedures for evacuation and protection. Modeling the tsunamis is fairly a simple task, but however handling the huge ocean bathymetry data is cumbersome and difficult at times. The incessant waves that we regularly see in the coast is called as short waves. The wave length is short may a meter or a couple of meters. Tsunami waves are called as long waves. Typically a tsunami waves length is about 200-300 Km. Hence the wave height associated with tsunami waves at the middle of the ocean is about half a meter to one meter only and a ship or a boat in deep ocean will not feel this tsunami wave until it is close to the coastal shelf. However when these waves approach the coastal shelf they ramify into a huge wave of heights going as high as 12-20 meters. Modeling tsunami is categorized into three phases.
(a) Source displacement
(b) Wave propagation
(c) Coastal inundation
The source displacement is generally the initial water level rise which is typical impulsive in nature with almost most of the analysists take it as water displacement at time t=0 s. This initial displacement of water can be attributed to the following scenarios;
(i) Plate lift off in a subduction zone (one tectonic plate moves into another tectonic plate) by earth quake
(ii) Landslide into the ocean
(iii) Asteroid falling into the ocean
Out of the three options the most likely event will be the earthquake. Valcano caused land slides into the ocean or asteroid falling are ever rare and unlikely events. However, they are of not that high a magnitude compared to the tectonic plate uplift caused tsunami. Most of the scientists around the world simulate the earth quake caused tsunami and a reasonably good model is required to translate the earth quake parameters to the initial wave height estimation which then will be the driving force for the second phase model in the tsunami analysis which is the propagation model. Everyone around the world use the Okada & Mansinha model (http://w3.ualg.pt/~jluis/mirone_/MironeMan2.htm?Elasticdeformation2.html) for this initial wave height estimation. This analysis is called as source modeling. Once the initial wave height for the area is known for an earth quake, the propagation model is just the dispersion of the water over the ocean space. This is where the big challenge start. The Mechanical Engineering and Civil Engineering guys who have studied Fluid mechanics and numerical solution procedures will appreciate that this grid analysis will help to solve the wave equation and simulate the wave height with respect to the time. One of the simplest method often people around the world use is to study the tsunami travel time chart. This is very simple to do and by properly using the coordinate frame and the distance from source, the time charts can be prepared by the contour plots with magnitude SQRT(H/g), where H is the depth of water column at the coordinate point and ‘g’ acceleration due to gravity. This simple calculation is used by all to draw the time contour lines from the source to the destination coast all over the sea(https://www.researchgate.net/figure/Travel-time-of-tsunami-waves-that-resulted-from-the-26-December-2004-event-in-the-Indian_fig3_235256056). This gives the guidance for the authorities to jump into action incase of a massive earthquake by estimating the breathing time they get for evacuvation. In case of the eastern coast of India, the potential subduction zones are Andaman, Indonesia and also near Burma. Assuming these source points one can easily draw the travel time charts for the eastern coastal zones. However for the west, the Makran zone (https://en.wikipedia.org/wiki/Makran_Trench) is the potential zone. One must keep in mind that the makaran caused tsunami impact or any western side tsunami impact on the coast is not vulnerable due to the fact that the bathymetry shows very shallow sea at Arabian sea compared to the bay of Bengal. The energy carrying potential is thus very low. Hence in other words, the Indonesian earthquake caused tsunami only need to be feared for western coast lands but not the tsunami created by quakes in the eastern side. A lot of parameters reveal the tsunami impact. In case of shallow water level near the source will reduce the initial magnitude and hence less effect. A coastal shelf a bit far from the coast into the sea and a very shallow sea like in the place of Colachal, near Kanniyakumari are highly vulnerable for amplified tsunami waves. Now the dispersion of the waves are done by solving the governing differential equations by the Finite difference method with a very good approximation suggested by Charles Mader (https://en.wikipedia.org/wiki/Charles_L._Mader) He suggested the approximation of tsunami waves by ignoring the terms with H/L where H is the water depth and L is the tsunami wave length. He approximated by comparing the wave length the depth of water column in sea is less and hence ignored those terms to reduce the computation loads. This equation became famous and was called as SWAN (Shallow Water Wave equation). You may visit his site and get educated more (http://www.drgeorgepc.com/MaderBookReview.html) . This scheme gives a good dispersion simulation of the initial wave amplitude over the ocean surface grid points where the wave height and the direction component velocities are computed and listed with respect to time. As I mentioned earlier, the simulation is very simple but handling such a large ocean data and that too in a different coordinate system (lat, Long) is the challenge. This dispersion analysis finally endsup in giving you the wave height and velocities at the destination coast which one is interested with. However, to accurately study the inundation pattern in each of the coastal towns, it is again the mandate of the user to do an interactive model i.e a Fluid structure Inspection study (FSI). This is where the Finite Volume (FV) formulation and solution will be very helpful. The success of any Tsunami code is by splitting the tsunami into a finite difference(FD) solution to quickly solve the dispersion problem over a vast sea surface and transfer all the parameters to the Finite Volume(FV) solver close to the coastal beach and into the land. By default one has to have a good sea bathymetry data stitched with the DEM land data to carry out these studies.
Below are the few of the codes which are free for download and use. Please see their operation manual for the proper input data preparation and running the codes. Some of them are capable of running on multi core processor (parallel processing) to reduce run times. Typiclly the FV solvers takes a long time typciall like 8 hrs or more which again depends on the mesh size/gris size.
TUNAMI-N2 code(Japanese) : http://www.tsunami.civil.tohoku.ac.jp/hokusai3/J/projects/manual-ver-3.1.pdf
MOST (Method Of Splitting Tsunami) code(American) : https://nctr.pmel.noaa.gov/model.html
ANUGA code (Australian): https://github.com/GeoscienceAustralia/anuga_core
https://www.youtube.com/watch?v=e_U2DVSLHic
MIRONE (Portugal): http://w3.ualg.pt/~jluis/mirone/main.html
COMCOT code : http://223.4.213.26/archive/tsunami/cornell/comcot_down.htm
Tsunami wave creation and propagation video:
https://www.youtube.com/watch?v=O1frjAmkWDc
Dam break models
Dam breaks are no different from the tsunami analysis except that the first two phases are not there. Hence the inundation model by the sudden release of water. The DEM model alone is adequate in this case and the bathymetry data associated with the ocean is not required. The flow interaction model is run for the area under study. In order to get the DEM data one can freely download from the internet (https://gisgeography.com/free-global-dem-data-sources/) they all will be mostly with an accuracy of 30 Arc second which is close to a few hundred meters. This means that the grid size is in few hundred meters, the land elevation data is available. However if we mesh the land surface a powerful bi linear interpolation method can be adopted to arrive at the approximated and interpolated intermediate points. ISRO provides these data through their BHUVAN portal(http://bhuvan.nrsc.gov.in/bhuvan_links.php) which is 1 Arc second, which is close to 32 meter grid. The BHUVAN Site requires a registration for downloading data but for the common viewing one can view without any registration in the website. The following are the codes very suitable for the dam breaks and river flows available in the internet which may be priced for the downloads.
FLOW3D code
https://www.flow3d.com/products/flow-3d/
MIKE Flow analysis code:
https://www.mikepoweredbydhi.com/products
Dam Break modeling.
https://www.youtube.com/watch?v=Q7x55ohyDxA
https://www.youtube.com/watch?v=9GgOJOWl3ms
landslide induced wave propagation;
https://www.youtube.com/watch?v=nSdpJREtY6M
However for the free opensource, the best code is ANUGA (https://github.com/GeoscienceAustralia/anuga_core)
Data format for the analysis:
It is imperative that for any climate model or the flood analysis model where large data set is involved it is required to choose a robust data management system. Typically to have a uniformity around the world, people have gone for using netCDF (network common data form). This is a machine independent array oriented data set to create, share and to manipulate the data with a comprehensive support to the common data manipulation libraries shared across the network. Now to understand the data, one has to understand that any Geo referencing require a lat, long format. The GPS devices and mobile based GPS system works with this data only. Since we are not into the data format, we often see the Geo referenced cities, places, shops, home and landmarks and never notice that they are placed on a coordinate frame called lat, long. What is this lat, long? Lat, Long is the intersection point of the latitude and longitude lines on the earth surface(https://qph.fs.quoracdn.net/main-qimg-952e0ed81d8c84521588eb3f4f2158c7) . Actually the latitude ranges from 0 to +90 and 0 to -90 , zero being the equator. They are in degree format which generally are represented in sexagesimal format which is degree-minute-second and also in decimal degree format. However, the longitude lines running from north pole to the south poles range from 0 to +180 degrees which is towards West and 0 to -180 degrees which is towards east. These longitude lines are referenced to the time zones. You can get educated on the UTM from the website https://gisgeography.com/utm-universal-transverse-mercator-projection/.
When dealing with the sea/ocean related data , the bathymetry data, the sea depth/height of water column is stored against the lat, long reference. It is left to the user to interpolate and use the data in between these available locations. Typically a 30 arc second data is commonly available for free in the opensource for any sea related modeling. The website General Bathymetry Chart of the Oceans (GEBCO) (https://www.gebco.net/data_and_products/gridded_bathymetry_data/) provides the data for the analysis. However, if and only if a very accurate analysis is required a local surveyed sea depth data can be obtained from the respective agencies and used. However, they are only made available to Govt. agencies for many reasons. The following are the data formats used for the DEM (land based data).
Digital elevation Model (DEM)
1) Space Shuttle Radar Topography Mission (SRTM)
2) ASTER Global Digital Elevation Model
3) JAXA’s Global ALOS 3D World
4) Mars Orbiter Laser Altimeter (MOLA)
5) Light Detection and Ranging (LiDAR)
6) BHUVAN – ISRO data (1 Arc sec ~32m grid)
(Ref: https://gisgeography.com/free-global-dem-data-sources/)
How to handle the data?
In actual sense the data is always geo referenced and hence it is in absolute refence. The best way to handle these large data set is to use some freely downloadable softwares that can read this format. The best I found was from Prof. Joaquim Luis (Portugal) who helped us to start with the tsunami analysis using the mirone code. Later we moved to ANUGA code for more control on the analysis. ANUGA is a python code. MIRONE is written in MATLAB. Prof. Joaquim Luis has written quite a few useful sowtwares for data manipulation. However the GMT open source programs can be downloaded from (http://gmt.soest.hawaii.edu/) or from (http://w3.ualg.pt/~jluis/mirone/downloads/gmt.html) . They are very powerful and useful tools with manipulating data like creating a new data set, cutting, stitching and interpolating. Just to give a feel Just after stitching DEM data with GEBCO, use the freely downloaded Mirone software to plot the zero elevation contour. That will be the precise coastline. Similarly, just with the DEM data and the data manipulation one can easily model the rainfall and flood by padding all the data less than the water level to zero and get all the terrain mapped with inundation. I mean one can easily visualize which all places in the town gets submerged and where are the maximum elevation points where the relief camps can be setup. There are GIS softwares which can simulate these. But even without that one can easily do the data manipulation and study the inundation by this way of data manipulation with the free tools.
Mitigation efforts:
After carrying out a detailed analysis the results are obtained to the extent of understanding mainly the wave run up height and inundation reach distance. This help to decide on the relief camps and support aid control room placement in strategic locations.
Tsunami mitigation:
1) Tsunami wall (https://commons.wikimedia.org/wiki/File:Wall_in_kalpakkam.JPG)
2) Growing up mangrove forest along the coast (https://www.sciencedirect.com/science/article/pii/S0272771405002246)
3) Growing up casuarina trees which can withstand coastal saline weather conditions(https://commons.wikimedia.org/wiki/File:Wall_in_kalpakkam.JPG)
4) Interlocking blocks-Tetrapods at goa(https://www.videoblocks.com/video/ocean-waves-striking-on-wall-made-of-huge-concrete-tetrapods-and-blocks-protecting-land-from-sea-erosion-in-goa-india-bbtneumcxj1napv6a)
Flood Mitigation:
1) Proper forecasting using climate models will help reduce dam water levels
2) Proper resisting barriers in vulnerable areas -erosion
3) Adequate marking of water levels at river banks and nearby villages in case of river swelling due to rains or excess water release at times of emergencies
4) Dam break water level markings in all low-lying villages near the rivers
5) Dump facilities in lower elevations to absorb the sudden release of water
6) Proper mass communication facilities to announce in advance about the dam water release
7) Establishment of emergency control rooms with direct satellite links for communication
8) Establishment of networked control rooms at all districts jump into action during exigencies
9) Ordained task forces with analytical abilities to analyze and predict the unfolding events to some reasonable accuracies with the backup of science and technology.
10) Periodic emergency drills to handle deluge
Education is the progressive discovery of our ignorance!!! - WILL DURANT
tagging:
#Floods;#tsunami;#Dambreak;#KeralaFloods;
#GMT;#Mitigation;#Waveequation;#FiniteDifference;#FiniteVolume;
#Emergency;#AdvanceWarning;#Subduction;#Inundation;#Bathymetry;#DEM;
(courtesy: Sarala Ram Kamal for her help in Publishing this article through the Note facility in FB)
- Details
- Written by: S. Joseph Winston
- Category: Science Article
- Hits: 335
SCIENCE OF WATER DROPS, SOAP BUBBLES & SURFACE TENSION
---------------------------------------------------------------------------------------------------

A scientific approach to the surface tension that we see in day-to-day life.
To read the full article Click this link ------> Download May2020_ScienceShore-19-23
(published in the Online Scineceshore Journal, Vol-1 , Issue-1, May 2020)
- Details
- Written by: S. Joseph Winston
- Category: Science Article
- Hits: 396
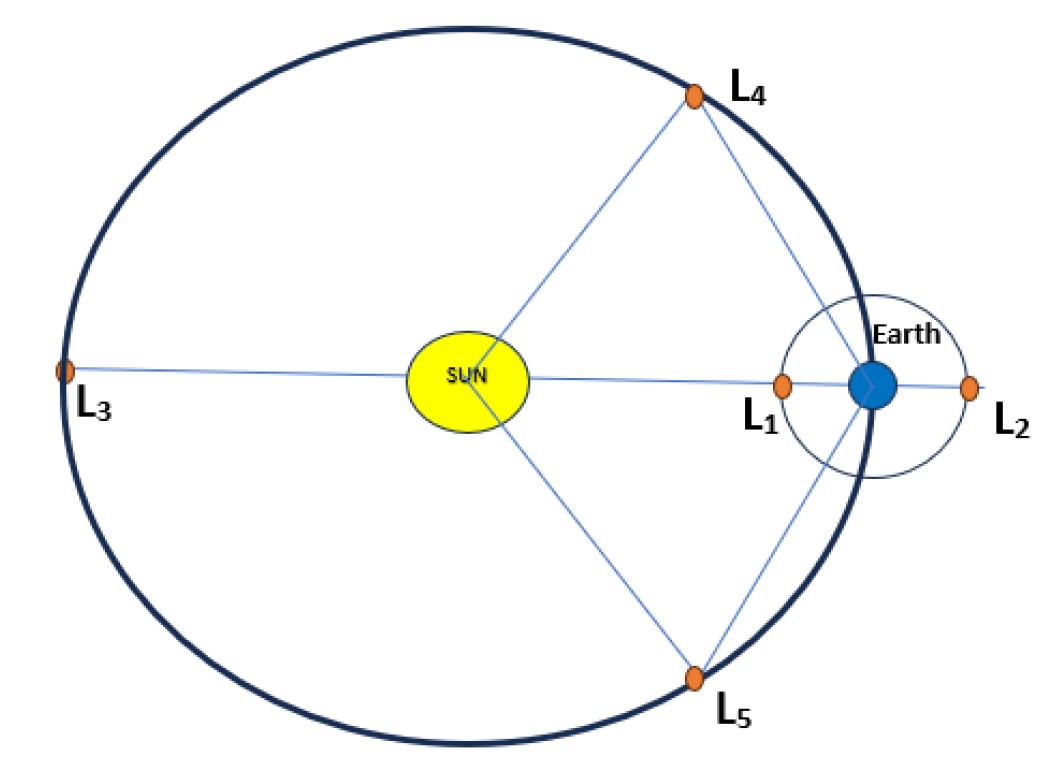
Any system that stores up energy influences a change in its state by dispensing the stored energy. This has become the key factor in identifying the unstable systems in the world that, after dispensing the stored-up energy, nudge to a least or nil energy state in its stable equilibrium position. In rocket science, if these positions are identified and the satellites are positioned in these places, it would eventually demand less fuel storage and sustain the intended research program for a long time. Any disturbances to the stable systems also would draw such systems back into the stable position, causing them to be passively stable. Observation of the sun requires the establishment of space laboratories inside the satellites placed at these stable points called Lagrange points, which are named after the scientist Lagrange. The forces that interact with the satellite systems are the gravitational forces of the Sun and Earth and the centrifugal forces of the satellite itself, which have an instantaneous center of rotation. Hence, the balance of these forces resolves to those Lagrange points.
This article sheds some light on the computation of the Lagrange points, and a case study shows how the Lagrange point is exploited to position the Aditya module for solar observation. Any comments, criticism, or suggestions are welcome.
(S. Joseph Winston)